- Home
- »
- Glossary Of Terms
- »
- Receivables Turnover Ratio
What Is the Receivables Turnover Ratio?
The Receivables Turnover Ratio is a financial metric that measures how efficiently a company collects payments from customers. It shows:
How quickly credit sales are converted to cash
The effectiveness of your accounts receivable management
Your business’s ability to extend credit wisely
Key Formula:
Receivables Turnover Ratio = Net Credit Sales ÷ Average Accounts Receivable

Why This Ratio Matters for Your Business
5 Critical Reasons to Track Receivables Turnover:
Cash Flow Health – Higher ratios mean faster collections
Credit Policy Evaluation – Reveals if your terms are too lenient/strict
Customer Quality Assessment – Identifies slow-paying clients
Financial Benchmarking – Allows comparison with industry standards
Early Warning System – Spots collection problems before they become crises
How to Calculate Receivables Turnover Ratio?
Step-by-Step Calculation:
Determine Net Credit Sales
(Total Sales – Cash Sales – Returns/Allowances)Calculate Average Accounts Receivable
(Beginning AR + Ending AR) ÷ 2Apply the Formula
Net Credit Sales ÷ Average AR
Example:
Annual credit sales: $1,200,000
Beginning AR: $150,000
Ending AR: $100,000
Average AR: (150,000+150,000+100,000)/2 = $125,000
Ratio: 1,200,000÷1,200,000÷125,000 = 9.6
Interpreting Your Ratio
Industry Benchmarks (Annual Turnover):
| Industry | Good Ratio | Warning Zone |
|---|---|---|
| Manufacturing | 8-12 | Below 6 |
| Retail | 10-15 | Below 8 |
| Service | 6-10 | Below 4 |
| Software | 12-20 | Below 10 |
High Ratio (Good):
Efficient collections
Tight credit policies
Strong cash flow
Low Ratio (Bad):
Collection problems
Poor credit management
Potential cash shortages
How to Improve Your Receivables Turnover
7 Proven Strategies:
Shorten Payment Terms – Move from Net-60 to Net-30
Offer Early Payment Discounts – 2/10 Net 30 terms
Automate Invoicing – Send invoices immediately
Implement Late Fees – Enforce penalties consistently
Conduct Credit Checks – Screen customers first
Improve Invoice Accuracy – Reduce disputes
Use Collection Software – Automated reminders
Receivables Turnover vs. Days Sales Outstanding (DSO)
| Metric | Measures | Formula | Ideal Value |
|---|---|---|---|
| RT | Collections per year | Credit Sales ÷ Avg AR | Higher better |
| DSO | Average collection days | (AR ÷ Credit Sales) × Days | Lower better |
Conversion:
DSO = 365 ÷ Receivables Turnover Ratio
FAQs
Varies by industry, but generally:
Below 5: Poor collections
5-10: Average
10+: Excellent
Monthly for growing businesses
Quarterly for established companies
Yes - extremely high ratios may indicate:
Overly strict credit policies
Lost sales opportunities
Cash-only business model
Lenders prefer ratios above industry average - shows you can:
Convert sales to cash quickly
Repay loans on time
Manage credit risk effectively

Other Free Resources

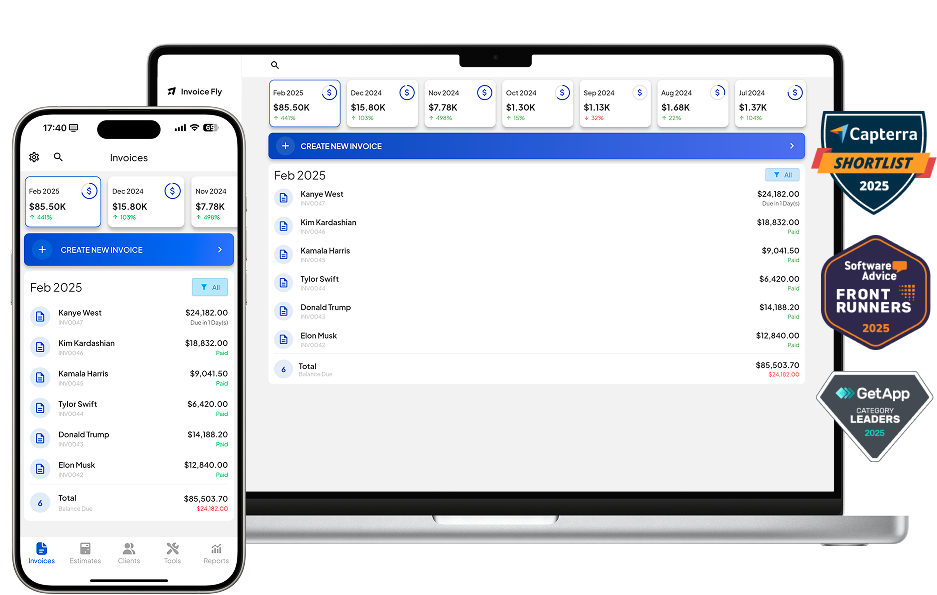
Try Invoice Fly Today
- Send quotes & invoices in seconds
- Collect card & online payments
- Receive instant notifications
- Win more jobs