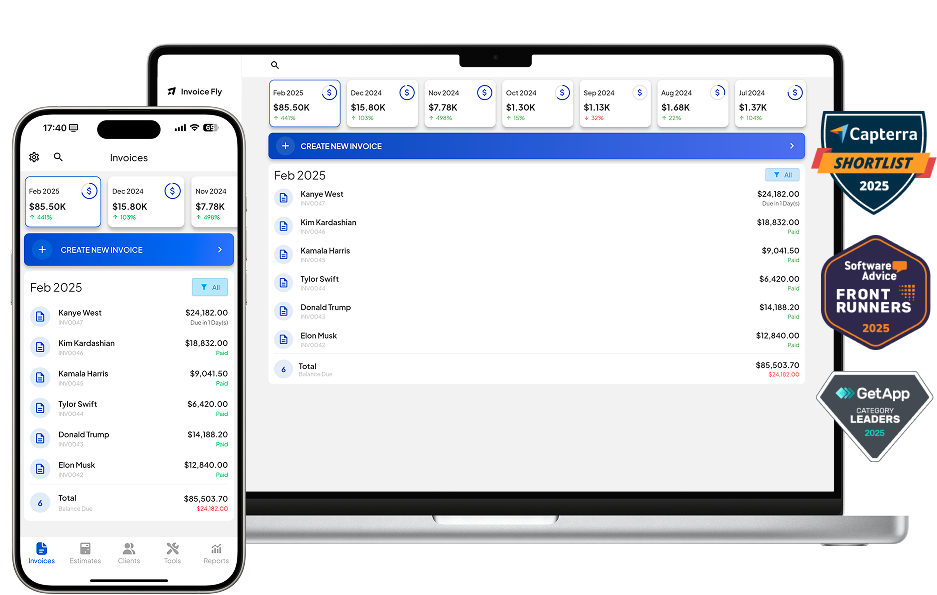
Business reports that help you make data-driven decisions
Our business reports give you an instant overview of your business cash-flow.
Quickly check paid invoices, monthly expenses and balance sheet – all at your fingertips.
125,000+ american pros trust Invoice Fly


Track your income, expenses & balance
with Invoice Fly’s business reports
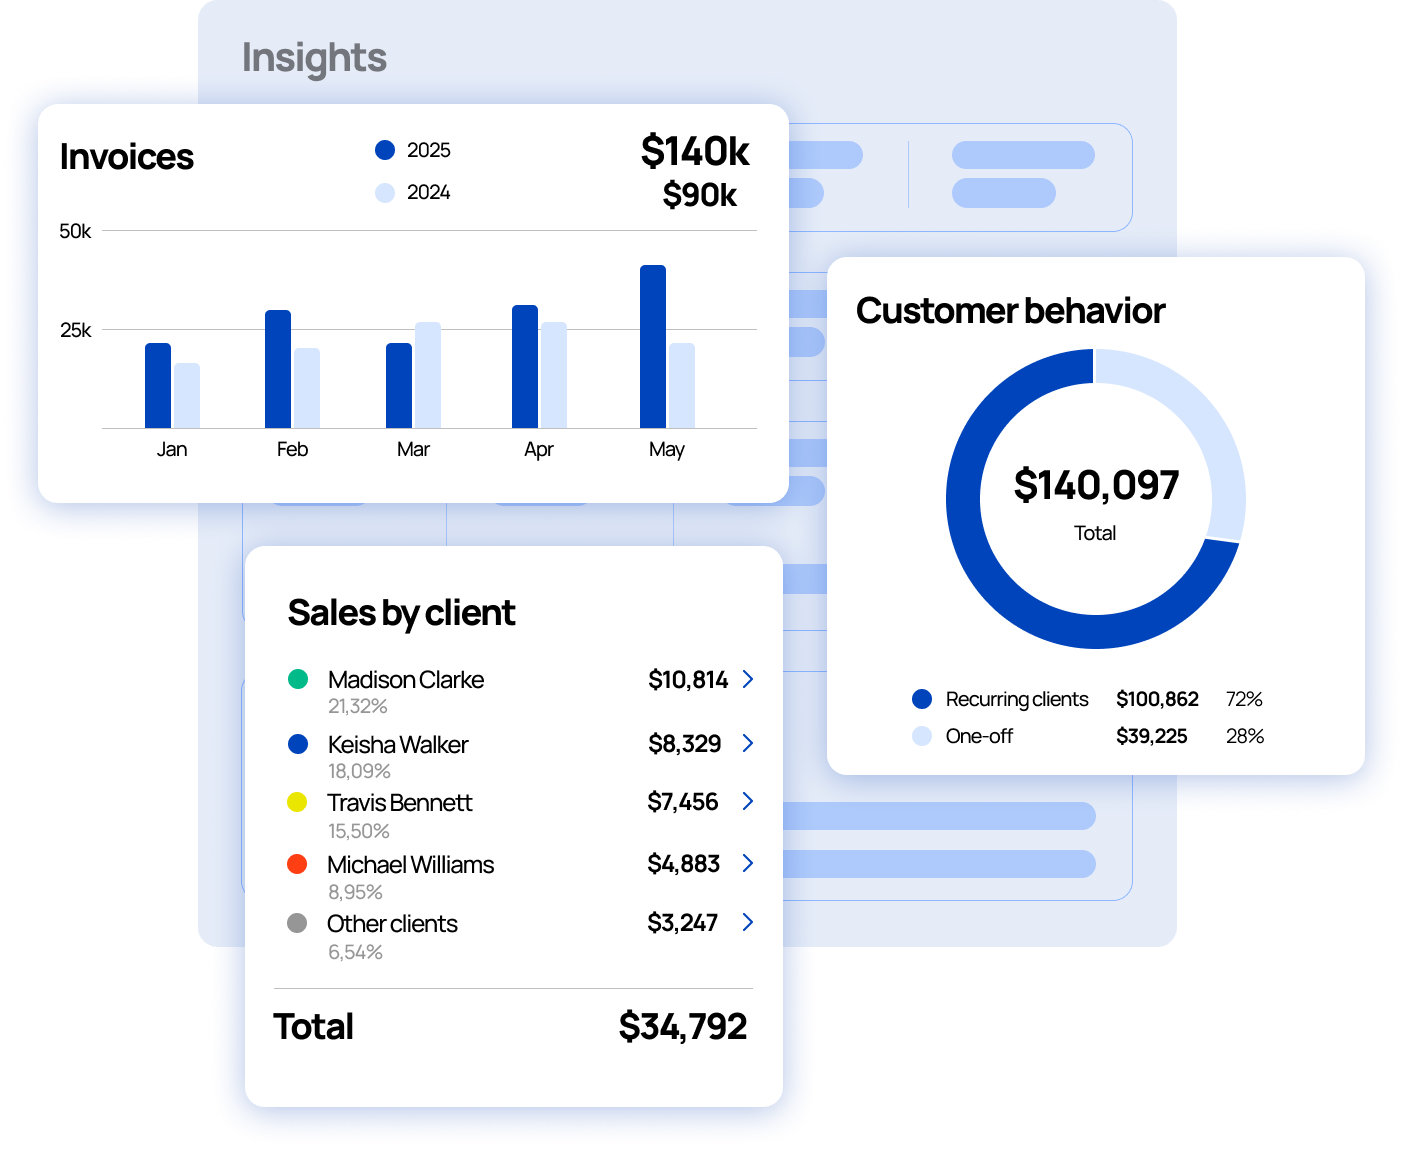
Check your business health at a glance with business reports
Business reports give you a clear, real-time snapshot of your company’s financial and operational health—all in one place.
By tracking key metrics like income, expenses, profit margins, and vendor activity, you can quickly spot trends, identify issues, and make smarter decisions.
Why do small businesses & contractors
rely on Invoice Fly’s business reports?
How do Invoice Fly’s business reports work?
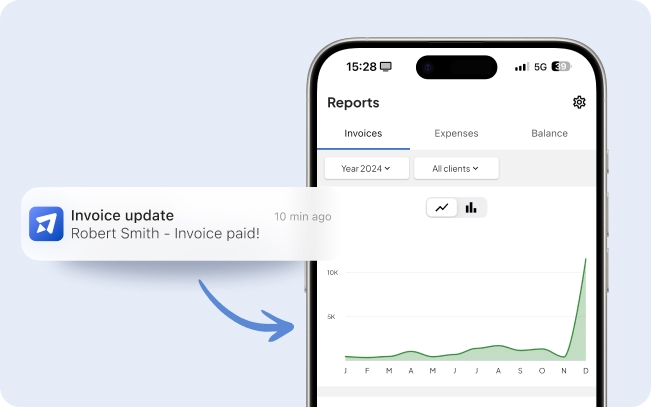
Track your income automatically every time an invoice is paid
Every time you receive a payment from one of your invoices, our software will automatically register that income to the invoices report, so you can keep track of all payments.
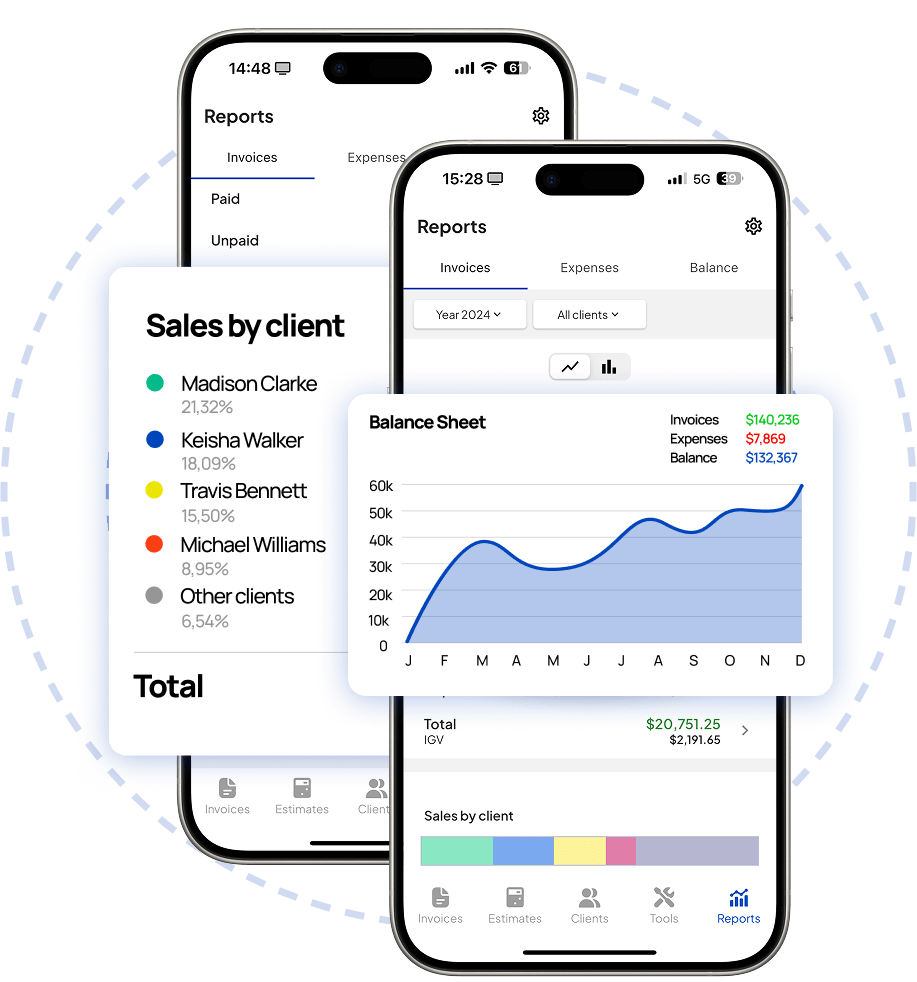
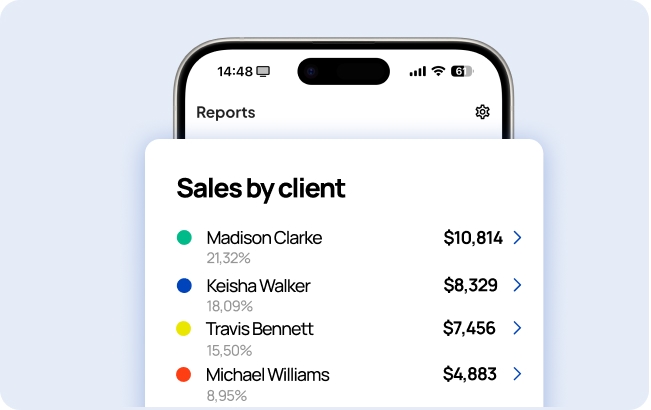
Get close insights about how much every client contributed to the total revenue.
The report will automatically share the insights of the nº of invoices you have sent to every client, the total revenue per client and the % of contribution to total revenue on a specific period of time.
Track your business expenses by scanning all your receipts
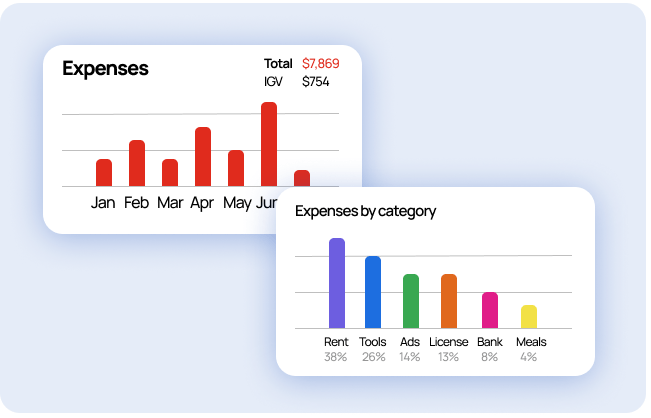
Every time you have a business expense, scan the receipts or add them manually to Invoice Fly. Our software will automatically create a chart where you can easily track the months with more expenses.
Sort your business expenses by category and by merchant
Our mobile app automatically shows you which expense category and merchant you spend the most on.
This helps you identify where your money goes so you can make smarter decisions and save more effectively.
Get a final balance sheet to understand your business financial health
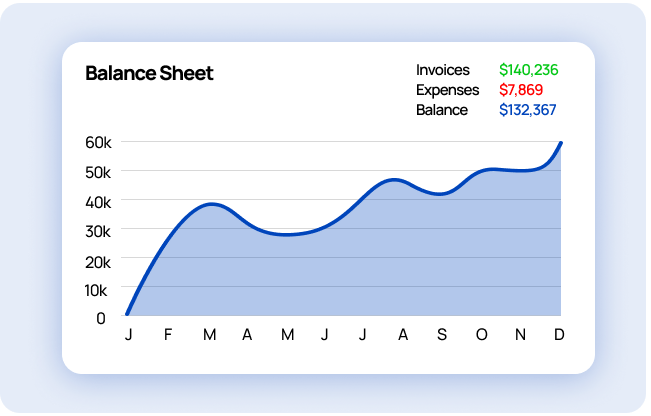
When your income and expenses are displayed on the same chart, you get a clear snapshot of your business’s financial health.
See which months brought in the most revenue and when your spending peaked. These insights help you improve cash flow and boost profitability.
How do SMEs & blue collar workers benefit from
Invoice Fly’s business reports?
Our business report feature is specifically tailored for small businesses and blue collar workers from the US and all around the world, who need to check their financial status from a secure and cloud-based invoicing software, at any time, and from anywhere.
4h+
saved every week
with automated business reports & balance sheet.
25%
of expenses saved
by identifying expensive merchants.
24/7
online access
to business reports, from the job site or the office.
Customized solutions for 50+ industries
Do more with the right set of tools
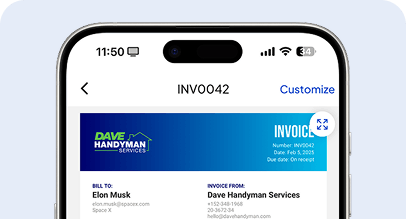
Send professional, polished invoices that make a great impression. Easily customize each one with your branding, payment terms, and itemized details. With built-in online payments and clear layouts, you’ll get paid faster—no chasing, no confusion.
Invoicing Software
Win more jobs by sending professional-looking estimates. Get them approved and kickstart new projects.
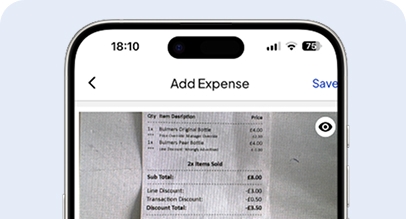
Receipt Scanner
Collect online payments with Credit Card or PayPal, Stripe, Apple Pay, American Express, Visa, MasterCard, and more.

Client Portal
Manage all your client’s details, invoices, estimates and statements from a secure and cloud-based online platform.
Pick the best plan for you.
Get the tools you need to work smarter, stay in control, and grow with confidence.
What are business reports?
Business reports are structured documents that analyze, track, and present key information about a company’s performance, operations, and financial health. These reports help small business owners, managers, and stakeholders make informed decisions based on real data.
Common types of business reports include:
- Financial reports (income statements, balance sheets, cash flow reports)
- Sales and revenue reports
- Expense and budget reports
- Inventory and operations reports
- Customer insights and performance metrics
Business reports can be generated manually or automatically using tools and software like Invoice Fly. They provide insights into what’s working, what needs improvement, and where the business can grow—making them essential for strategic planning, financial analysis, and decision-making.
How to use Invoice Fly’s
business reports?
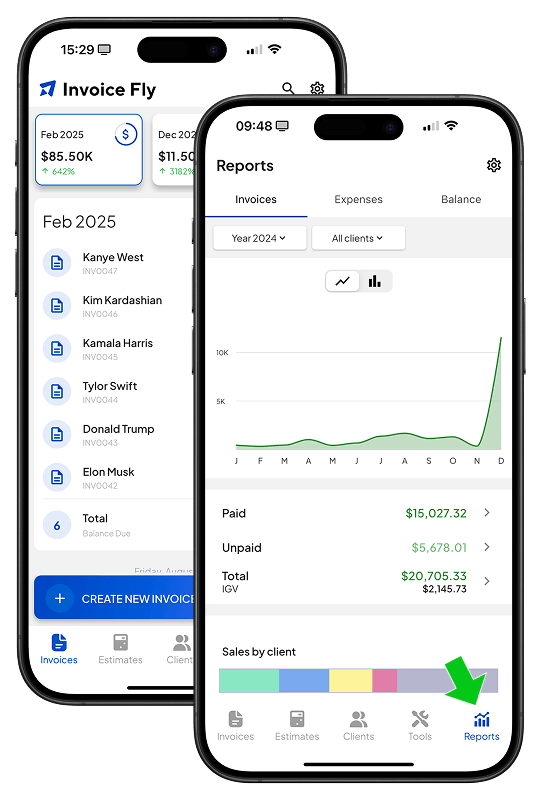
Step 1: Log in to Invoice Fly
- Open the app or desktop software
Open Invoice Fly mobile app on your phone, or log in from your computer browser.
- Click on "Reports"
Once inside, click on the “Reports” button on the bottom part of the app, on the navigation menu.
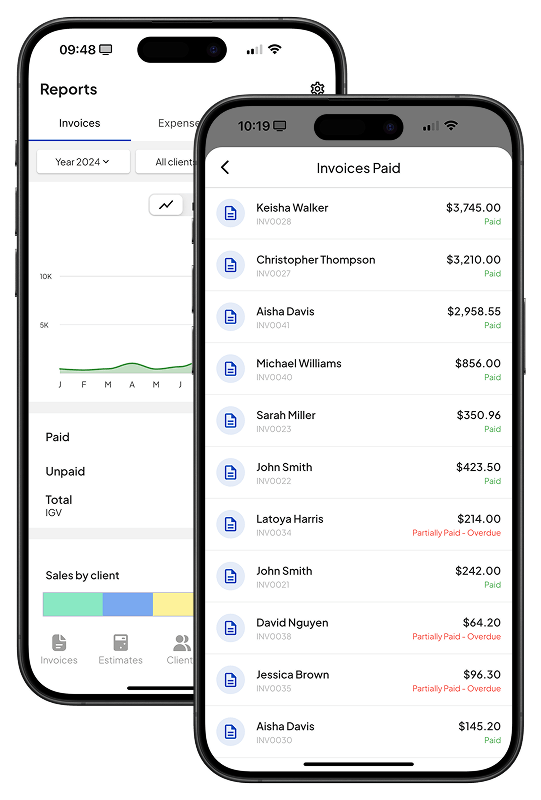
Step 2: Send invoices to your clients and get them paid
- Make sure every invoice you sent is paid
Our software automatically generates an income report with all the invoices that have been sent.
It will differentiate between paid and outstanding invoices, so you get a clear overview.
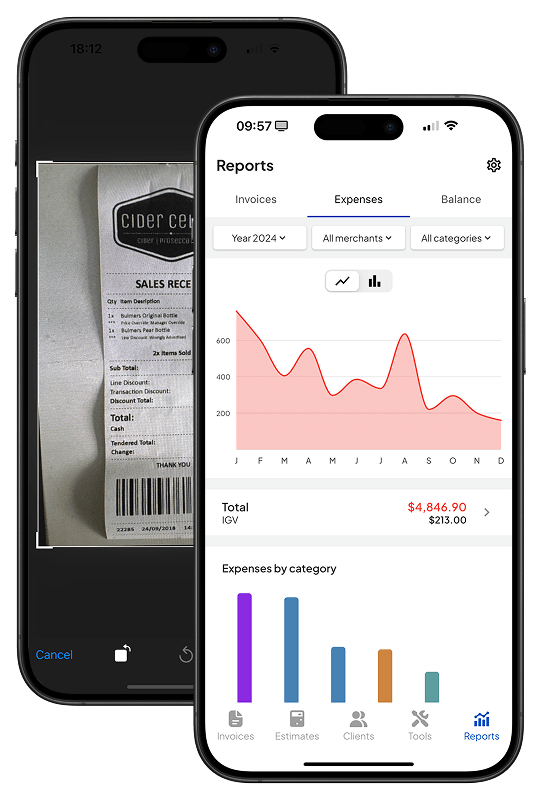
Step 3: Add all your receipts & track all the expenses
- Scan receipts or add them manually
Add every expense to the app and organize them by categories. Name every merchant for easier control.
The app will give you insights about how much you spent on every merchant by category (office supplies, transport, travel, fuel, tools, etc) and by merchant name, giving you quick insights on where you are spending the most.
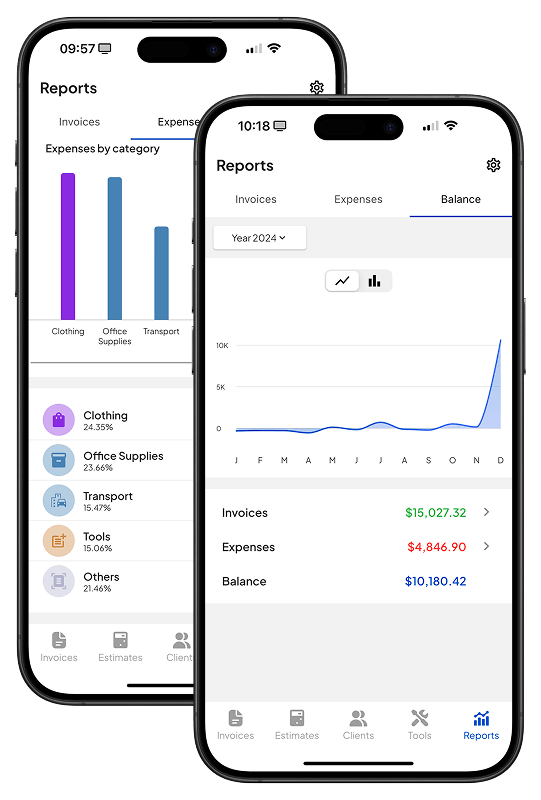
Step 4: Your final balance sheet
- Make data driven decisions with the balance sheet
Your final balance sheet helps you get the final view of your business cash-flow and financial health.
Get a quick view of the financial health and make data-driven decisions that will help you achieve your professional goals.
FAQs about our business reports
There are many types of business reports, but here are 5 of the most common:
- Financial reports: Includes balance sheets, income statements, and cash flow reports.
- Sales reports: Tracks sales performance, revenue trends, and customer behavior.
- Expense reports: Details company spending by category, vendor, or department.
- Operational reports: Covers productivity, inventory, supply chain, and workflow data.
- Marketing reports: Analyzes campaign performance, conversion rates, and ROI.
Each type of business report provides valuable insights that help companies make data-driven decisions and improve overall business efficiency.
Business reports are formal documents that present data, analysis, and insights about different aspects of a company. They help track performance, support strategic planning, and guide financial or operational decisions.
Examples of business reports include:
- Profit and Loss (P&L) Statement
- Balance Sheet
- Customer Satisfaction Report
- Monthly Sales Report
- Inventory Management Report
These reports can be created manually or generated automatically through accounting and business intelligence tools.
While both are essential for business management, they serve different purposes:
- Business Report: A broad term that includes any report related to company performance, such as sales, operations, HR, or marketing.
- Financial Report: A specific type of business report that focuses strictly on financial data like revenue, expenses, profits, assets, and liabilities.
In short, all financial reports are business reports, but not all business reports are financial.
A well-structured business report typically includes the following parts:
- Title Page: Includes the report title, date, and author.
- Executive Summary: Brief overview of the report’s purpose and key findings.
- Table of Contents: For easy navigation (used in longer reports).
- Introduction: Explains the report’s objective and scope.
- Main Body: Contains data, analysis, charts, and findings.
- Conclusion & Recommendations: Summarizes insights and next steps.
- Appendices: Includes supporting documents or data if needed.
These components help ensure clarity, readability, and actionable insights.
Key business ratios are financial metrics used to evaluate a company’s performance, profitability, liquidity, and efficiency. Common examples include:
- Current Ratio = Current Assets ÷ Current Liabilities (liquidity)
- Gross Profit Margin = (Revenue – COGS) ÷ Revenue
- Net Profit Margin = Net Income ÷ Revenue
- Debt-to-Equity Ratio = Total Liabilities ÷ Shareholder Equity
- Return on Investment (ROI) = Net Profit ÷ Investment Cost
These ratios help business owners assess financial health and guide smart decision-making.
Free Resources
Resources to run your business smoothly and efficiently.

Try Invoice Fly Today
- Send quotes & invoices in seconds
- Collect card & online payments
- Receive instant notifications
- Win more jobs
