Debt to Equity Ratio Explained: Formula, Calculation, and Interpretation
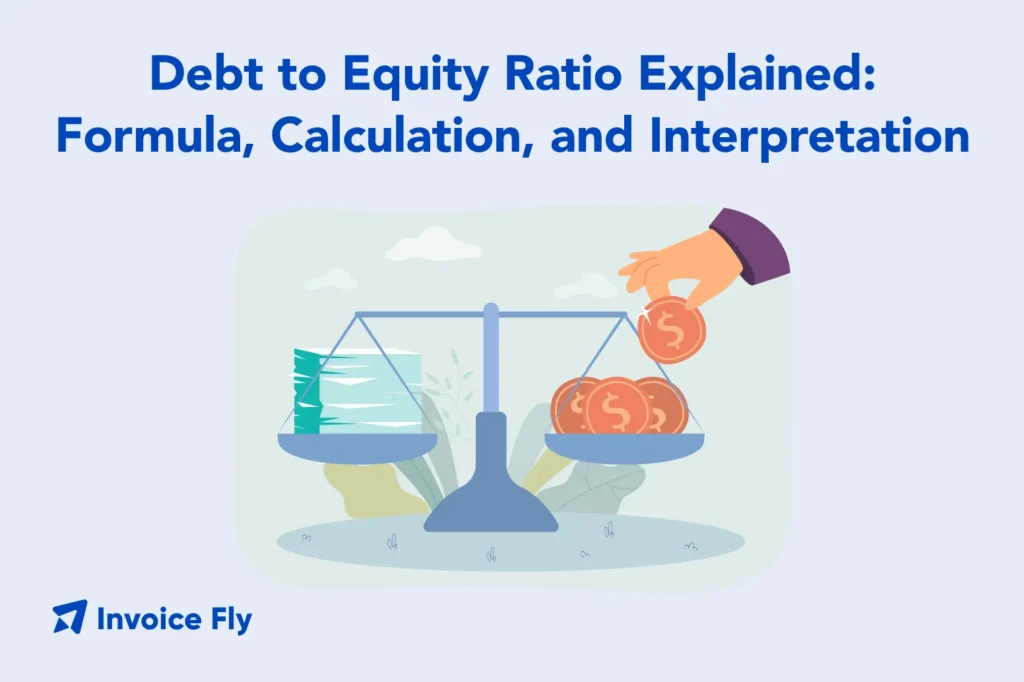
Table of Contents
- What Is the Debt to Equity Ratio?
- How to Calculate Debt to Equity Ratio
- Interpreting Debt to Equity Ratio
- Industry and Company-Specific Debt to Equity Ratios
- Common D/E Ratio Mistakes to Avoid
- Benefits of Monitoring Debt to Equity Ratio
- Quick Reference: Variations You’ll See
- Worked Examples You Can Reuse
- How D/E Connects to Lenders, Valuation, and WACC
- Conclusion About the Debt to Equity Ratio
- FAQs About Debt to Equity Ratio
The debt to equity ratio (often written D/E) shows how much a company relies on borrowed money (debt) versus owner financing (equity). In plain terms, it answers: “For every dollar owners put in, how many dollars did the company borrow?” Understanding this ratio helps owners, managers, and lenders judge financial leverage, risk, and room for growth.
In this guide, you’ll learn what the debt to equity ratio means, the formula, how to calculate it step by step, how to interpret high and low values, and where typical ranges differ by industry. We’ll also walk through examples and common mistakes to avoid.
What Is the Debt to Equity Ratio?
The debt to equity ratio compares a company’s interest-bearing debt to its shareholders’ equity. It tells you how much financing comes from creditors versus owners.
You’ll find the inputs on the balance sheet:
- Debt (interest-bearing): bank loans, bonds, notes payable, lines of credit, and finance lease liabilities (if material).
- Equity: what owners have after liabilities are paid (common stock, additional paid-in capital, retained earnings, minus treasury stock).
Quick note: “Equity” grows when you keep profits in the business (retained earnings) and when owners add more capital.
What the D/E Ratio Means
| Ratio Value | What It Means | Implications |
| 1.0 | Equal amounts of debt and equity | Balanced capital structure |
| Below 1.0 | More equity than debt | Lower leverage, stronger cushion |
| Above 1.0 | More debt than equity | Higher leverage; potential risk |
| Very High (3.0 +) | Heavily debt-financed | May tighten cash flow; investors wary |
| Very Low (0.3 or less) | Minimal debt usage | Very stable but may miss growth funded by cheap debt |
There is no single “perfect” ratio for all businesses. The right range depends on your industry, business model, earnings stability, and growth plans.
Quick note: You may also see the “equity to debt ratio” (equity ÷ debt). It’s the inverse, showing how much of your business is financed by owners rather than lenders.

How to Calculate Debt to Equity Ratio
Formula for Debt to Equity Ratio
Debt to Equity Ratio = Total Debt ÷ Total Equity
Where:
- Total Debt = interest-bearing short-term debt + long-term debt (include finance lease liabilities if material).
- Total Equity = shareholders’ equity (owner’s equity for sole proprietors/partnerships).
Some analysts use total liabilities instead of debt, but that can overstate leverage. For small business analysis, stick to interest-bearing debt for clearer insights.
Debt to Equity Ratio Step-by-Step Calculation Example
Example A — Basic
- Short-term bank loan: $100,000
- Long-term loan: $500,000
- Total Equity: $400,000
Debt = $100,000 + $500,000 = $600,000
D/E = $600,000 ÷ $400,000 = 1.5
Interpretation: the company uses $1.50 of debt for each $1.00 of equity. That’s moderate to high leverage depending on the industry.
Example B — Including Finance Leases
- Short-term debt: $40,000
- Long-term debt: $160,000
- Finance lease liabilities: $50,000
- Equity: $300,000
Debt = 40,000 + 160,000 + 50,000 = $250,000
D/E = $250,000 ÷ $300,000 = 0.83
Interpretation: below 1, meaning more equity than debt.
Tip: Keep your journal entries and supporting documents tidy so the debt and equity numbers are easy to pull for reporting. If you need a refresher on recording transactions properly, review accrual basis accounting principles.

Interpreting Debt to Equity Ratio
What Is a Good Debt to Equity Ratio?
A “good” debt to equity ratio depends on your business type:
- Stable, asset-heavy sectors (utilities, telecom, manufacturing) tolerate higher D/E. According to the USDA ERS, successful farms balance debt and equity to fund capital while protecting earnings.
- Cyclical or early-stage businesses (startups, retail) keep D/E lower to weather downturns.
- Service and software companies favor low leverage because they have lighter assets.
Rule of thumb: 0.5 – 1.5 is common for many small businesses, but your ideal range should reflect margins, cash flow, and interest coverage.
High vs Low Ratios and Business Implications
| Ratio Type | Pros | Cons |
| High D/E | – Cheaper debt can boost return on equity (ROE) if growth outpaces borrowing costs.- Allows expansion without giving up ownership. | – Higher risk if cash flow weakens.- Loan covenants may restrict flexibility.- Rising interest rates increase payment burden. |
| Low D/E | – Greater resilience in downturns.- Easier to meet financial obligations.- More flexibility and liquidity. | – May be under-leveraged—missing out on profitable growth if affordable debt is avoided. |
Whether your business leans toward a high or low debt to equity ratio, the real insight comes from seeing how leverage interacts with your other financial metrics.
Connect the Dots with Other Metrics
- Interest coverage (EBIT ÷ interest expense) shows your ability to service debt.
- Current ratio and working capital highlight short-term liquidity and day-to-day resilience.
- WACC (weighted average cost of capital) reveals whether taking on more debt helps or hurts long-term value creation.
By comparing these metrics side by side, you can tell if your leverage is working for you — driving growth efficiently — or working against you by adding unnecessary risk.
Tip! For context on managing cash alongside leverage, see our guide on contractor cash flow management and calculate cash flow formula.

Industry and Company-Specific Debt to Equity Ratios
The ideal debt-to-equity (D/E) ratio isn’t one-size-fits-all. It depends heavily on the industry’s business model, asset structure, and cash-flow stability.
- Capital-intensive industries such as utilities, airlines, energy, and heavy manufacturing usually have higher D/E ratios. These companies rely more on long-term borrowing to finance expensive assets, but they can safely do so because of predictable revenues and asset collateral. Financial analysis from Yahoo Finance shows how utility companies like Xcel Energy maintain elevated debt ratios due to stable cash flows from long-term contracts.
- Asset-light sectors like software, technology, and professional services often maintain lower D/E ratios, since they rely more on equity and operational cash flow rather than borrowing.
- Retail and consumer businesses fall somewhere in between—their leverage varies based on lease commitments, inventory levels, and brand maturity.
Company Examples of D/E Ratio: Apple, Tesla, Microsoft
Below are three directional snapshots of major tech companies that illustrate how capital structure choices can differ among large tech firms.
| Company | D/E Ratio | What It Means |
| Apple | 1.56 | Moderately high leverage for a tech giant. Apple’s massive share buybacks reduce equity, which inflates its D/E ratio on paper. In reality, its strong cash reserves and top-tier credit rating offset much of the financial risk. |
| Microsoft | 0.56 | A conservative capital structure. Microsoft’s recurring subscription revenue and enormous equity base allow it to maintain low leverage while funding growth internally. |
| Tesla | 0.77 | Low-to-moderate leverage. Tesla has paid down much of its early debt and now funds expansion largely through retained earnings and steady operating cash flow, signaling financial maturity. |
Ratios reflect median data over the past 10 years (2015–2025). Always check the reporting period, as D/E can shift with buybacks, retained earnings, new borrowing, and market valuation changes.
Why Context Matters
While tech leaders like Apple and Microsoft showcase disciplined capital structures, smaller firms and penny stocks tell a different story.
Companies with market caps under $100 million often experience extreme D/E fluctuations because of thin profit margins, short-term financing, or inconsistent cash flow. According to Simply Wall St., such volatility can make debt ratios less reliable indicators of financial strength. For these businesses, cash flow trends and debt servicing ability matter more than the ratio itself.
Key Takeaway
The “right” D/E ratio depends on scale and sector:
- Apple’s higher ratio isn’t inherently risky—it reflects equity reduction, not instability.
- Microsoft’s low ratio signals financial resilience and flexibility.
- Tesla’s moderate leverage shows a balance between growth and discipline.
- Penny stocks and early-stage firms need closer analysis beyond headline ratios, since one funding round or loss can dramatically distort the numbers.
For a global comparison, see the OECD corporate debt-to-equity indicator, which tracks leverage trends across countries and sectors.
Tip: If you calculate D/E using total liabilities instead of interest-bearing debt, label it clearly as Liabilities-to-Equity. It will always read higher and isn’t directly comparable to standard D/E ratios.
Common D/E Ratio Mistakes to Avoid
| Mistake | Why it’s a problem | Fix |
| Using total liabilities instead of interest-bearing debt | Overstates leverage and skews comparisons | Use interest-bearing debt for operating analysis; if you use total liabilities, label it clearly |
| Mixing book and market values | Book equity ≠ market cap; inconsistent bases distort ratios | Use book values from the same financial statement for both debt and equity |
| Ignoring lease liabilities | Finance/operating leases can be significant debt-like obligations | Include lease liabilities where material |
| Negative equity cases | D/E becomes meaningless or negative | Flag separately; analyze interest coverage, cash flow, and turnaround plan |
| Seasonal snapshots | Ratios swing with inventory and receivables | Compare trailing four quarters and seasonal averages |
| Not adjusting for one-offs | Large impairments or gains can distort equity | Note unusual items and review multi-period trends |
Understanding these mistakes helps you read an income statement and profit and loss statement more critically when assessing a company’s true leverage position.
Benefits of Monitoring Debt to Equity Ratio
- Clear view of leverage to right-size borrowing and protect cash.
- Better lender discussions with data on risk and coverage.
- Early warning when margins tighten or rates rise.
- Smarter capital planning: align D/E with growth plans and WACC.
- Cleaner reporting to investors, partners, and boards.
Pair D/E tracking with monthly closes, income statement reviews, and clean balance sheet reconciliations for a full picture. If your invoicing is a bottleneck, tighten terms with invoice payment terms and use our Invoice Generator to speed collections.
Track your leverage alongside revenue and net income using Business Reports to see how your financial structure supports (or hinders) profitability.

Quick Reference: Variations You’ll See
- Debt-to-Equity (narrow): Interest-bearing debt ÷ Equity (best for operating leverage).
- Liabilities-to-Equity (broad): Total liabilities ÷ Equity (shows all obligations).
- Equity-to-Debt: Equity ÷ Debt (inverse; higher is less leveraged).
Be consistent. If you change definitions, label your charts so comparisons remain fair.
Worked Examples You Can Reuse
Example 1 — Conservative structure
- Debt: $200,000
- Equity: $600,000
- D/E = 0.33
Implication: Ample cushion; may have room for prudent borrowing if returns exceed borrowing cost.
Example 2 — Growth via leverage
- Debt: $1,200,000
- Equity: $800,000
- D/E = 1.50
Implication: Higher leverage; check interest coverage and loan covenants.
Example 3 — Seasonal retailer
- Q2: Debt $700,000, Equity $500,000, D/E = 1.40
- Q4: Debt $300,000, Equity $650,000, D/E = 0.46
Implication: Track quarterly and use seasonal averages before making big decisions.
Example 4 — Negative equity caution
- Debt: $300,000
- Equity: –$50,000
- D/E: Not meaningful
Implication: Focus on cash flow, interest coverage, and turnaround steps, not D/E.
How D/E Connects to Lenders, Valuation, and WACC
- Lenders favor predictable cash flows and reasonable D/E; lower leverage can earn better rates.
- Valuation: Capital structure influences discount rates. Too much debt can raise risk; too little may limit growth.
- WACC: Debt is usually cheaper than equity (after tax), but adds risk. Aim for a mix that minimizes WACC and keeps risk acceptable.
For practical planning, pair D/E with profit trends and cash conversion cycle. Understanding gross profit vs net profit helps you see whether leverage is amplifying returns or just adding risk without reward.
Conclusion About the Debt to Equity Ratio
The debt to equity ratio is a simple but powerful snapshot of financial leverage. Use the formula (Debt ÷ Equity), keep inputs consistent, and compare across time and industry. High or low isn’t good or bad on its own—the key is whether your ratio fits your business model, supports growth, and keeps risk in check.
Build the habit: update D/E monthly or quarterly, review alongside interest coverage, working capital, and cash flow, and document any one-time events. With a clear view of leverage, you’ll make smarter financing decisions and communicate more confidently with lenders and investors.
Master the basics of small business bookkeeping to ensure your debt and equity figures are accurate and reliable for decision-making.